


Introduction
Lecture evaluation is a system implemented in universities to ensure the quality of education. Feedback from university students places a burden on professors to improve the quality of their lectures. In Korea, with the Education Reform Measures on May 31, 1995, discussions on improving university education intensified, making lecture evaluation a major issue. Lecture evaluation is generally conducted for two purposes. The first is the formative purpose of improving the professor’s teaching for the students’ learning enhancement, and the second is the summative purpose of evaluating the professor’s ability [1-3].
The College of Medicine has characteristics that set it apart from the other colleges. For example, the number of professors participating in one lecture is greater in medical schools than in others, and faculties are classified into clinical (who treat patients) and non-clinical faculties. As there are many faculty members, each member has relatively fewer lecture hours, compared to those at other colleges. Providing medical treatment in the university hospital is one of the major duties of the clinical faculty, so the workload for student lectures is relatively small [4]. Therefore, faculty evaluation at the College of Medicine was replaced by clinical practice, despite efforts to improve lecturing, resulting in lecture evaluation having relatively less importance [5]. However, since the decision on November 27, 1997, to adopt a new system in South Korean medical schools, the medical education evaluation and accreditation implemented since 2000 have emphasized the importance of lecture evaluation in them [6].
According to a meta-analysis study by Yang [7], there are eight lecture factors, 11 student factors, and nine instructor factors that influence lecture evaluation. The lecture factor includes lecture level, class size, department, teaching method, academic year, time of day, regular/special class, and learning environment. The student factor includes grade level, grade point average, gender, class participation, major, military service status, interest in lecture evaluation, motivation for taking the lecture, non-serious responses, and perceived difficulty of the lecture. The instructor factor includes academic rank, age, lecture structure and activities, department affiliation, class hours, and teaching experience [7]. Most studies have been conducted using a cross-sectional design, which does not allow for the determination of causality. Therefore, longitudinal studies are necessary to confirm causality between factors. Additionally, examining the correlation of several factors over time using the same lectures and evaluation form is essential. Furthermore, only few studies have been conducted on factors related to instructors, while most address gender and rank [8,9]. However, it is difficult to see age and gender as factors that determine a good instructor, as teaching ability and method are more important qualities in becoming a good instructor. This study identifies instructor factors affecting lecture evaluation by analyzing sophomores’ lecture evaluation performed over a 4-year period in a college of medicine, examining each cluster’s characteristics, and comparing differences between trajectories.
Methods
1. Study participants
The second year of medical school is conducted through an Integrated Curriculum, where clinical theory and basic medical lectures are integrated. In the first year of medical school, students take classes on normal human anatomy and diseases, while clinical practice begins in the third year. In the Integrated Curriculum, various clinical and basic professors teach together on related organs such as the respiratory and cardiovascular systems. This type of teaching is a characteristic method in medical schools. Therefore, the evaluation of the lectures conducted for the second-year medical students was selected as the research subject. The study surveyed sophomores at Dankook University College of Medicine, where the evaluation of integrated education lecture began in 2012, and lecture evaluation data were collected from 2015 to 2018. Integrated Curriculum Management Guidelines were developed in the latter half of 2016, and lecture evaluation meetings were regularly held. Since 2017, there have been alterations to the integrated education.
In total, 13 lectures incorporated the activities to improve the integrated curriculum in each year. The Integrated Education Committee reinforced self-evaluation, according to the management regulations for continuous improvement. Specifically, exam questions and learning goals were matched to evaluate the adequacy of the learning goal achievement evaluation, and an integrated curriculum seminar summarizing the first semester of 2018 was held in August 2018 based on the lecture improvement results.
Table 1 shows the characteristics of the faculty classified by lecture, instructor’s teaching hours per year, and number of instructors per lecture. Lecture evaluation in Dankook University College of Medicine is performed using four question items: (1) Was the textbook or learning material adequate? (2) Were class hours adequately observed? (3) Could you adequately understand the lecture content? (4) Did the lecture help you to study by yourself? The answers are rated on a 5-point scale (5=strongly agree to 1=strongly disagree). The four question items were selected from the variables used in previous studies [5]. The selection of these variables was made through discussions with the former dean and professors in the Department of Medical Education, and only four questions were used to provide quick feedback to professors and students. The results are provided to the professor in charge and all faculty members giving lectures, and the mean score of the four items is reflected in the faculty evaluation.
2. Data analysis
A longitudinal model was employed and a chi-square test and generalized estimating equation (GEE) model were used to identify factors affecting lecture evaluation by medical students. This study also used a cluster analysis that forms clusters of similar objects and analyzed each cluster’s characteristics based on the similarity of given variable characteristics, and latent class analysis, a groupbased trajectory analysis methodology. The Bayesian information criterion was used to compare the model fit for the number of groups, with lower values indicating better fit. Research data were analyzed using SAS ver. 9.4 program (SAS Institute Inc., Cary, USA), and the statistical significance of all analyses was set at p<0.05.
Results
There were 190–256 instructors by year, and the mean lecture satisfaction decreased gradually from 4.4 in 2015 (standard deviation [SD]=0.34) to 4.01 in 2018 (SD=0.31). Instructors’ average teaching hours per year decreased from 3.9 (SD=3.7) to 3.5 hours (SD=3.1). The number of instructors per lecture increased from 18.4 in 2015 (SD=4.1) to 20.5 in 2018 (SD=3.8) (Table 1).
Table 2 shows longitudinal analysis results through the GEE model using data from 2015 to 2018. The teaching hours per instructor in a year increased by an hour, and decreased by -0.003 (B=-0.003; 95% confidence interval [CI], -0.006 to 0.000) as the number of instructors per lecture increased by one individual. The curriculum was altered around 2017, and the lecture evaluation score decreased by -0.068 (B=-0.068; 95% CI, -0.079 to -0.058) after the reform (2017) compared to before (2016) (Table 2).
Table 3 displays the general characteristics obtained after performing a cluster analysis on the first lecture evaluation results from 2015 to 2018, excluding those of redundant lectures. They showed that there were three clusters and a significant difference (p=0.0001) in lectures, teaching hours, and number of instructors per lecture among the clusters. Cluster 1 had lectures on reproductive medicine, gastroenterology, neurology, emergency medicine and traumatology, behavioral science, and pulmonology, along with 2.8 teaching hours a year Analysis for Detailed Contents of Lecture Evaluation (SD=2.2) and 23 instructors per lecture (SD=3.2). Cluster 2 had lectures on infection and clinical immunology, musculoskeletal system, endocrine and metabolism, cardiovascular system, and introduction to clinical medicine, along with 2.6 teaching hours a year (SD=1.5) and 16 instructors per lecture (SD=2.6). Cluster 3 had lectures on nephrology and urology systems, along with 11.1 teaching hours a year (SD=2.9) and 15 instructors per lecture (SD=2.7).
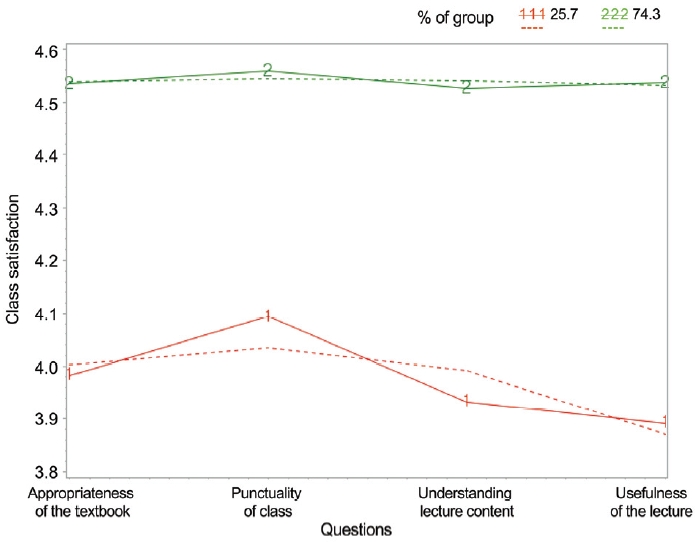
Table 4 shows the relevance of lecture evaluation scores using the GEE model, after a trajectory analysis on four lecture items (Fig. 1) was conducted based on the first lecture evaluation results, excluding the results of redundant lectures, from 2015 to 2018. Two trajectories, based on model fit, were extracted during the trajectory analysis. The first trajectory had lower lecture evaluation scores overall, but relatively high appropriateness of the textbook and punctuality of class. However, the second trajectory had higher lecture evaluation scores overall for the four items. The lecture satisfaction trajectory analysis with the GEE model revealed that the lecture evaluation score of the first trajectory, with relatively lower lecture satisfaction, reduced by -0.078 (B=-0.078; 95% CI, -0.091 to -0.066) compared to the second trajectory which had high overall lecture satisfaction.
Discussion
Two trajectories were extracted during the trajectory analysis. The second trajectory had higher overall lecture satisfaction, and the first trajectory had lower lecture satisfaction but relatively higher punctuality of class and appropriateness of the textbook scores. The lecture evaluation score difference between the two trajectories was statistically significant (p<0.0001). The second trajectory, with higher lecture satisfaction, showed little change in appropriateness of the textbook, punctuality of class, understanding of lecture content, and usefulness of lecture. The first trajectory, with lower lecture satisfaction, had low scores in the understanding of lecture content and usefulness of lecture and a relatively large change in trajectory. The two trajectories showed differences in teaching methods (understanding of lecture content and usefulness of the lecture) rather than in external factors (appropriateness of the textbook and punctuality of class). The instructors’ proficiency in conducting the lecture was deemed more important than external factors (the appropriateness of the textbook used or punctuality of class), in classes for sophomores at the College of Medicine.
These results are similar to the study by Kim [10], which claims that a good class according to students is “a class where they can acquire knowledge,” “a class that offers excellent explanation,” and “a class with knowledge utility.” However, a poor class is “a class that lacks sincerity,” “a class that lacks explanation or communicability,” and “a class that is not motivating” [10]. Students perceive classes with good explanation and communicability, or instructor’s efficient lecturing skills, as “good classes.” Kim et al. [11], who conducted an analysis based on the scores of lecture evaluation performed for 3 years found similar results. Lectures showing a continuous decline in the scores for 3 years were due to “lack of motivation” and “no sincerity,” and lectures showing a continuous increase were due to “detailed and easy-to-understand explanation about the content” and “application of various teaching-learning methods” [11]. There is a difference in the lecture satisfaction between students and instructors. Instructors claimed that “devoting to lecture preparations” affects lecture satisfaction the most, whereas students attached the most importance to “conducting the lecture while considering the level of students” [12]. Joo et al. [13] also revealed that professors considered “student performance management” and “teaching skill” more important, whereas students prioritized “developing programs for improving teaching skill.”
Longitudinal analysis revealed that the score decreased by -0.002 (95% CI, -0.003 to 0.000) as the teaching hours per instructor increased by an hour in a year, and decreased by -0.003 (95% CI, -0.006 to 0.000) as the number of instructors per lecture increased by one individual. The results of the cluster analysis showed that there was a difference in lecture satisfaction among clusters. Cluster 1 had an average of 2.8 teaching hours per year (SD=2.2) and 23 instructors per lecture (SD=3.2), Cluster 2 had an average of 2.6 teaching hours per year (SD=1.5) and 16 instructors per lecture (SD=2.6), and Cluster 3 had an average of 11.1 teaching hours per year (SD=2.9) and 15 instructors per lecture (SD=2.7). The increase in the number of instructors per lecture, and the increase in teaching hours per instructor in a year were opposite indicators. However, when comparing Clusters 1 and 2, Cluster 2 was found to have less teaching hours per year even though it had fewer instructors than Cluster 1. This may be because lecture hours and the number of instructors varied depending on the lecture.
Generally, the increase in teaching hours for instructors can be expected to leave them with less time to concentrate on one lecture, resulting in low lecture evaluation scores. However, according to Kim et al. [14], increase in teaching hours led to higher lecture evaluation scores. Kim et al. [14] assumed that this was because more teaching hours offers more time to develop lecturing skills. However, the present study showed that an increase in teaching hours led to a decline in lecture evaluation scores because instructors at the College of Medicine had to simultaneously engage in clinical practice, reducing their dedicated time for lectures.
An increase in the number of instructors per lecture led to a decrease in lecture satisfaction scores due to the nature of the lectures in the sophomore year. Integrated education —block lectures—is introduced during the second year. For example, for gastroenterology, professors of anatomy, physiology, gastroenterology, and surgery share parts of the lectures [15]. When several instructors share block lectures, it is difficult to ensure lecturing consistency, resulting in less organized lectures.
However, the cluster analysis results showed that Cluster 3 had a lower lecture satisfaction score than Clusters 1 and 2, with 15 instructors per lecture, which is the lowest. Cluster 3 had 11.1 teaching hours, much greater than Clusters 1 (2.8) and 2 (2.6). Higher teaching hours and fewer instructors per lecture led to the lowest lecture satisfaction scores, implying that there might be a problem in lecture quality if the instructor exceeds the average of 3.5 to 3.9 teaching hours.
The Dankook University College of Medicine developed the Integrated Curriculum Management Guidelines, focusing on integrated education, and has applied them since 2017. According to the guidelines, improvement activities such as managing the quality of the lecture evaluation survey, holding meetings between students and the professor in charge to improve lectures, and developing lecture improvement plans for each curriculum were systematized. The longitudinal analysis showed that the number of instructors per year increased from 190 in 2015 to 250 in 2016, 249 in 2017, and 256 in 2018. The number of instructors per lecture increased from 18.4 in 2015 (SD=4.1) to 20.5 in 2018 (SD=3.8), while teaching hours decreased from 3.9 in 2015 (SD=3.7) to 3.5 in 2018 (SD=3.1). However, lecture satisfaction decreased from 4.40 in 2015 (SD=0.34) and 4.41 in 2016 (SD=0.40), which was before the implementation of improvement measures, to 4.19 in 2017 (SD=0.34) and 4.01 in 2018 (SD=0.31). After implementing these improvements, the lecture satisfaction decreased (B=-0.068; 95% CI, -0.079 to -0.058). This appears to be due to the quality management of the lecture evaluation survey conducted according to the enhanced self-evaluation function, students’ perception of the importance of lecture evaluation, and a stricter attitude toward the lecture satisfaction survey than before. The study by Park et al. [5] on sophomores at a medical college revealed that students could not properly respond to the lecture evaluation as it was difficult and they felt uncomfortable due to their relationship with teachers, leading to generous feedback. Kim [16] also revealed that students felt bothered by lecture evaluation and pressured by its anonymity. SDs in the present study decreased somewhat after the improvement measures, due to change in student perception about the importance of lecture evaluation.
This study has some limitations. It measured lecture satisfaction using four survey items but was limited to analyzing instructor factors. In general, lecture satisfaction through lecture evaluation can be evaluated using multiple factors. The Dankook University College of Medicine has a lecture evaluation form containing many items. However, this study selected only four items for clarity and comparison by year and compensated for the shortcomings with short-answer questions. Unlike other studies, this study focused on instructor-related factors, by forming independent variables around instructors. These limits controlling for confounding variables by failing to control for student factors. However, this study closely analyzed the characteristics of lecture evaluation by examining the characteristic differences among clusters as identified through the cluster analysis. Clusters are formed based on proximity after measuring the similarity between variables [17]; the target group is understood based on clustering and the clusters can be used efficiently [18]. Moreover, examining the trajectories of each group through trajectory analysis helped identify the characteristics [19,20]. This study has an advantage in that it performed a complex analysis using both these methods.
The satisfaction of second-year medical school students with their lectures increases with higher annual lecture hours per instructor, it is also more important to increase the “understanding of lecture content” and “usefulness of lecture” than external factors of the lecture such as the “appropriateness of the textbook” and “punctuality of the class.” To improve lecture satisfaction, it is necessary to enhance instructional competencies through lectures or seminars on teaching methods, adjust teaching hours so that it does not exceed 3.5 hours per instructor by assigning an adequate number of instructors, and maintain an adequate number of instructors per lecture. In a further study, it is necessary to analyze the effectiveness of lectures or seminars on teaching methods for instructors and implement a new teaching method, followed by an analysis of its effects.